Which Way is North
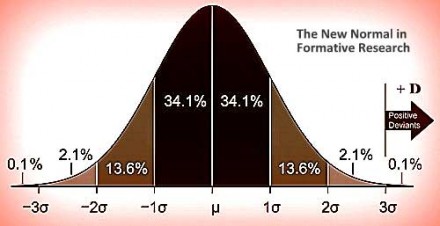
Social scientists and social change practitioners have found the normal bell-shaped curve to be of immense value when making inferences about population parameters from sample statistics. By paying attention to the mean values and standard deviations in a normal distribution with a representative sample, one can predict — with a high degree of confidence — the odds in favor of, or stacked against, solving a problem (see Figure 1).

“We dance round in a ring and suppose, But the Secret sits in the middle and knows.”
Normal bell-shaped distributions, for instance, can tell social change practitioners that most African-American children who grow up in poor inner-city neighborhoods, in a single parent household, would be highly unlikely to finish high school in a timely manner and/or graduate with a college degree; or that most Pashtun women living in remote and mountainous communities of Pakistan’s Khyber Pakhtunkhwa Province will be at high risk for pregnancy-related complications that could jeopardize their health and the health of their newborn; or that most poor, uneducated and newly-married women in the highly patriarchal and rural areas of India’s Bihar State will be highly unlikely to exercise their free will in adopting a contraceptive method.
Simply put, a normal curve distribution can give social change practitioners insights on the nature and scope of a problem in a population, including what is normative – i.e. what is the most likely case, scenario, or outcome for most of the people. In all likelihood, most poor African-American students of inner-city neighborhoods will not finish high school in time; most married women in Khyber Pakhtunwa will face pregnancy-related complications; and most poor married women in rural Bihar will not be able to practice birth control of their free will.
Such data, when collected prior to designing an intervention, can help social change practitioners gauge the severity of a problem in a community. Actionable intervention strategies can then be conceived to plug gaps, reduce deficits, and overcome problems. This is how the normal curve is normally employed to scope out, and solve, problems.
Unfortunately, our record in solving social problems is highly dismal when normal distributions are employed to gauge what ails most of the population. The darker areas under the normal curve is where most of the people in a population are situated (Figure 1).

Figure 1. The new normal for social change interventions: Focus on the characteristics of the positive deviants who are 3-plus more standard deviations away from what is normative. Note that a normal bell-shaped curve is symmetrical about its mean (μ). The numbers on the x-axis represent the number of standard deviations (σ) away from the mean. The area under the curve shows that roughly 68% of all cases fall within 1 standard deviation of the mean, 95% of cases within 2 standard deviations of the mean, and almost all of the cases within 3 standard deviations of the mean.
I suggest that we establish a “New Normal” to use normal distribution curves to identify not what is wrong with most people, but rather what is working with the very few, the positive deviants (See Figure).
Let me illustrate what I mean by the “new normal” use of the normal curve.
During the summer of 2012, in collaboration with a dozen field researchers, I led a formative research inquiry in certain urban slums of New Delhi, India. Our purpose: to provide data-driven inputs to the design of a mass media health campaign to promote small family size, emphasizing delay of first child and spacing between children, focusing attention on women’s and newborn child health, countering the preference for male children, and encouraging adoption of a wide range of contraceptive methods.
As opposed to gathering and analyzing deficit-based “normative” data, our fieldwork instead was guided by sensibilities of focusing on the “new normal” aspects of a data distribution i.e. were there any positive outliers: That is, were there individuals, couples, and health workers who had found better family planning solutions than most of their peers without access to any extra resources?
Through analysis of archival data and key informant interviews, we identified several positive deviants. What were these statistical outliers doing that resulted in highly successful outcomes?
One of our married woman respondents noted that she had significantly reduced her risk of getting pregnant by keeping a close track of her menstrual cycle, avoiding sex during the days she was at highest-risk for conception. During these na na din (“no, no days”), she employed a variety of bahanas (excuses) to avoid intercourse with her husband. She would, for instance, tell her husband that “I am keeping a vrat (fast) for a few days for your health,” or “I am not feeling well these days.” On her “yes, yes days,” when she was not at high risk for conceiving, she noted: “I go out of my way to please him”.
While most married women in her situation would not be in a position to negotiate sex with their husbands, our respondent had found creative, culturally-appropriate strategies to reduce her risk for conception. After all, how could an Indian husband overrule his wife’s sacred vrat? And that, too, to preserve his health!
We met a positive deviant health worker who employed certain uncommon practices that yielded high rates of male vasectomy. When he organized vasectomy camps in rural areas, several men who previously had agreed to have their tubes snipped, either did not show up on the appointed day, or were hesitant to be the first to undergo the procedure. Their dilly-dallying negatively impacted other participants’ motivations, and many of the assembled men would dissipate, much to the chagrin of camp organizers.
To overcome this problem, our health worker arranged for a few men, who were eager to undergo the vasectomy, to stride up – in open view of other men — and demand that they be the first to be snipped. And after they had undergone their vasectomy, usually a quick and painless procedure, they would stride out with musteid chaal (a stallion’s stride), boasting about how easy the whole thing was. Such creative orchestration of theatrical elements helped reduce the anxiety of other men, significantly boosting rates of adoption of vasectomy.
While most health workers would shrug their shoulders and embrace disappointment, our respondent found a creative way to reduce the anxiety of vasectomy prospects, i.e., presenting other men as “social proof” that there was no cause for worry.
What is most intriguing about the behavioral practices of our positive deviants — the fasting strategy for husband to forego sex, and the theatrical manifestation of “social proof” in a vasectomy camp — is that they do not represent normative actions. These behaviors could only be discovered because we focused our attention on statistical outliers, cases that were several standard deviations (in the positive direction) away from the mean.
The main point here: When normal distribution curves are used “normally” to assess problems, needs, gaps, and deficits, social change practitioners are rendered blind to the assets that may exist in a population – i.e. what has been working within the community, working against all odds, and without access to any extra resources.
We call for a “new normal” or NEW NORTH for social change interventionists. That is, use the normal curve to identify statistical outliers who deliver uncharacteristically positive outcomes. And then learn from these outliers about what they are doing right that can be can be amplified for the larger normative populous.
Curator’s note: There are a lot of great resources on positive deviance but you might start with some of Arvind’s stories. You’ll catch the reflections of one of the pioneers of positive deviance, Monique Sternin, here:
Arvind’s Inviting Everyone, co-written with Prucia Buscell and Curt Lindberg, looks at positive deviance in a healthcare setting while Protecting Children from Exploitation and Trafficking, co-written with Lucia Dura, looks at positive deviance and child protection in Uganda…
…and Indonesia:
_____
Editor’s note: Which Way is North is a blog originally published at The talk to walk to, a site that shares views and news on communication and development. The site’s approach to “Communication” is as an embrace of the full spectrum of meaningful definitions in a child rights-focussed development context, including advocacy and strategies that promote participation.
Dr. Arvind Singhal is the Samuel Shirley and Edna Holt Marston Endowed Professor of Communication and Director of the Social Justice Initiative in UTEP’s Department of Communication. Dr. Singhal’s research has been supported by the Centers for Disease Control and Prevention, Ford Foundation, Rockefeller Foundation, The National Science Foundation, The David and Lucile Packard Foundation, UNAIDS, UNICEF, among others.


